
Case study: asset utilisation
This case study illustrates the use of the staircase package for analysing asset utilsation. In this example we have a group of 3 identical assets, X, Y, and Z. These assets are parallel machines, such as bays in a carwash. Each asset can either be in one of two states - on or off (or alternatively working or not working).
The data used is this case study is synthetic and fictional. Both data and the notebook for this tutorial can be obtained from the github site.
[1]:
import pandas as pd
import staircase as sc
import matplotlib.pyplot as plt
We begin by importing the asset data into a pandas.DataFrame instance. Each row corresponds to a period of time that an asset is being used. The first column identifies the asset, while the second and third columns give the start and end times of the period of use respectively.
[2]:
data = pd.read_csv(r"./data/asset_use.csv", parse_dates=['start', 'end'], dayfirst=True)
data
/home/docs/checkouts/readthedocs.org/user_builds/railing/envs/v1.6.4/lib/python3.8/site-packages/ipykernel/ipkernel.py:283: DeprecationWarning: `should_run_async` will not call `transform_cell` automatically in the future. Please pass the result to `transformed_cell` argument and any exception that happen during thetransform in `preprocessing_exc_tuple` in IPython 7.17 and above.
  and should_run_async(code)
[2]:
| asset | start | end | |
|---|---|---|---|
| 0 | Y | 2020-01-01 00:06:00 | 2020-01-01 00:21:00 |
| 1 | Z | 2020-01-01 00:50:00 | 2020-01-01 01:39:00 |
| 2 | Y | 2020-01-01 00:54:00 | 2020-01-01 01:51:00 |
| 3 | Z | 2020-01-01 02:14:00 | 2020-01-01 03:03:00 |
| 4 | Y | 2020-01-01 02:29:00 | 2020-01-01 03:26:00 |
| ... | ... | ... | ... |
| 15079 | Z | 2020-12-31 19:28:00 | 2020-12-31 20:17:00 |
| 15080 | Y | 2020-12-31 20:59:00 | 2020-12-31 21:14:00 |
| 15081 | Y | 2020-12-31 22:15:00 | 2020-12-31 22:37:00 |
| 15082 | Z | 2020-12-31 22:40:00 | 2020-12-31 23:29:00 |
| 15083 | Y | 2020-12-31 22:50:00 | 2020-12-31 23:47:00 |
15084 rows × 3 columns
For the analysis we would like a Stairs object for each asset. Each Stairs object will represent a step function which takes a value of zero, when the asset is not in use, and a value of one when the asset is in use. We define a function called “make_stairs” which, given a dataframe, creates a Stairs instance based on columns called “start” and “end”. We can then use this function, in conjunction with a groupby-apply, to create a pandas.Series indexed by asset name, with Stairs values.
[3]:
make_stairs = lambda df: sc.Stairs(use_dates=True).layer(df.start, df.end)

asset_use = data.groupby(['asset']).apply(make_stairs)
/home/docs/checkouts/readthedocs.org/user_builds/railing/envs/v1.6.4/lib/python3.8/site-packages/ipykernel/ipkernel.py:283: DeprecationWarning: `should_run_async` will not call `transform_cell` automatically in the future. Please pass the result to `transformed_cell` argument and any exception that happen during thetransform in `preprocessing_exc_tuple` in IPython 7.17 and above.
  and should_run_async(code)
We can access an individual Stairs object with the corresponding asset name. For example, to plot the step function corresponding to asset Z:
[4]:
asset_use['Z'].plot()
[4]:
<AxesSubplot:>
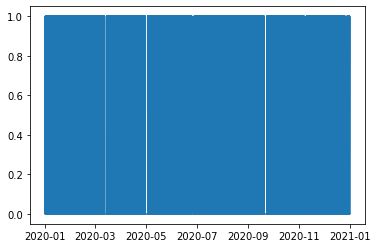
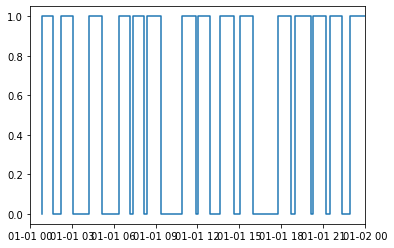
A wall of blue! Perhaps our asset is oscillating between not used and used (0 amd 1 respectively) so often that plotting an entire year is not helpful. Let’s confirm this conjecture by capturing the axes which is being plotted onto, and “zooming in” on the first day of 2020:
[5]:
ax = asset_use['Z'].plot()
ax.set_xlim('2020-1-1', '2020-1-2')
[5]:
(18262.0, 18263.0)
Because these assets belong to a group, we are interested in their combined utilisation, i.e. the addition of the three step functions. This can be achieved by simply summing up the Stairs objects:
[6]:
combined_asset_use = asset_use['X'] + asset_use['Y'] + asset_use['Z']
Note that we can also achieve the same result by leveraging the panda.Series.sum method. That method leverages the addition operator defined by the Stairs class to perform the calculation.
[7]:
combined_asset_use = asset_use.sum()
Using the integrate method we can see that the three assets together worked for a total of 13,176.7 hours in the year 2020.
[8]:
combined_asset_use.integrate(pd.Timestamp('2020'), pd.Timestamp('2021'))
[8]:
13171.933333334659
Given there are 3 assets, and 8784 hours in the year, there are a total of 26,352 hours that the assets could have worked - approximately double the hours used. It is not surprising then that calculating the average group utilisation for the year 2020 is approximately 1.5:
[9]:
combined_asset_use.mean(pd.Timestamp('2020'), pd.Timestamp('2021'))
[9]:
1.4995370370371879
Now we will look to discover how often exactly none of the assets were being used. If we compare our combined_asset_use Stairs instance to 0, then the result is a Stairs instance. This object represents a binary (or boolean) valued step function, which takes value 1 whenever there are 0 assets being used.
[10]:
combined_asset_use == 0
[10]:
<staircase.Stairs, id=139963066883328, dates=True, tz=None>
The question, of how often none of the assets are being used, can be answered with the help of the mean method:
[11]:
(combined_asset_use == 0).mean(pd.Timestamp('2020'), pd.Timestamp('2021'))
[11]:
0.12352572859733262
So there are no assets being used at all, during 2020, approximately 12.3% of the time. If we wish to further this idea by extending to 1, 2, or 3 assets being used, then we can do so with a list comprehension to store each result. We wrap this in a pandas.Series for convenience:
[12]:
combined_utilisation = pd.Series([(combined_asset_use == i).mean(pd.Timestamp('2020'), pd.Timestamp('2021')) for i in range(4)])
combined_utilisation
[12]:
0    0.123526
1    0.378038
2    0.373810
3    0.124626
dtype: float64
Note that as of version 1.2 the Stairs class has a method called hist which can perform the previous calculation much faster.
[13]:
combined_asset_use.hist(pd.Timestamp('2020'), pd.Timestamp('2021'))
[13]:
[0, 1)    0.123526
[1, 2)    0.378038
[2, 3)    0.373810
[3, 4)    0.124626
dtype: float64
We can see from this result that all assets are being used approximately 10.1% of the time. Since the values are fractions of a whole, if we sum the values in the series we should get a value of 1. Let’s check:
[14]:
combined_utilisation.sum()
/home/docs/checkouts/readthedocs.org/user_builds/railing/envs/v1.6.4/lib/python3.8/site-packages/ipykernel/ipkernel.py:283: DeprecationWarning: `should_run_async` will not call `transform_cell` automatically in the future. Please pass the result to `transformed_cell` argument and any exception that happen during thetransform in `preprocessing_exc_tuple` in IPython 7.17 and above.
  and should_run_async(code)
[14]:
1.0
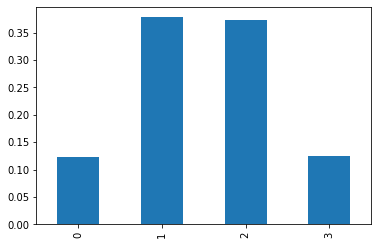
We can also use the pandas.Series plotting methods to get a quick visual of this utilisation breakdown:
[15]:
combined_utilisation.plot.bar()
[15]:
<AxesSubplot:>
Using various methods from the Stairs class we can answer questions such as “How often is X working while Y is not?”: (25.4%)
[16]:
(asset_use["X"] > asset_use["Y"]).mean(pd.Timestamp('2020'), pd.Timestamp('2021'))
[16]:
0.25360314207661805
“How many assets were being used at 9:40am on the 5th of September?: (2)
[17]:
combined_asset_use(pd.Timestamp(2020, 9, 5, 9, 40))
[17]:
2
“Which 2 assets were being used at this time?”: (X and Y)
[18]:
asset_use.apply(lambda s: s(pd.Timestamp(2020, 9, 5, 9, 40)))
[18]:
asset
X    1
Y    1
Z    0
dtype: int64
If we’d prefer to work with “idleness”, instead of “in use”, we can create a Stairs object to capture this. The idea is to start with a step function with value 3 everywhere (since we have 3 assets) and subtract the step function for “in use”:
[19]:
combined_assets_idle = sc.Stairs(3, use_dates=True)-combined_asset_use
The number of assets idle at 9:40am on the 5th of September should be 1 right? Let’s check:
[20]:
combined_assets_idle(pd.Timestamp(2020, 9, 5, 9, 40))
[20]:
1